How many of you have this problem: you classify your images in ecognition or any other software and exported classified image as shape file. Now you want to view the shape file in a GIS environment and with the same color for each class that was used in eCognition. Manually matching color RGB values from eCognition to shape colors for each class is a tedious task, specially when you have many classes.
This problem can be solved with a little trick.
- Do your classification in eCognition. Assign class colors as you wish.
- Export classification result as shape file with Class attributes.
- Export classification result as thematic raster. By doing so, you will get a CSV file in which you can get RGB color codes for each class.
- Load your shape file in GIS (I use QGIS which is free. I am a poor guy therefore I always love free stuffs)
- Load the CSV file in QGIS
- Perform attribute Join of shape file and CSV file with key attribute join based on Class. With this you will get RGB values attached in attribute table of shape file.
- Double click color symbology of shape file and use data defined properties of color attributes of shape file.
- Build an expression for color selecting respective color attribute column from shape file.
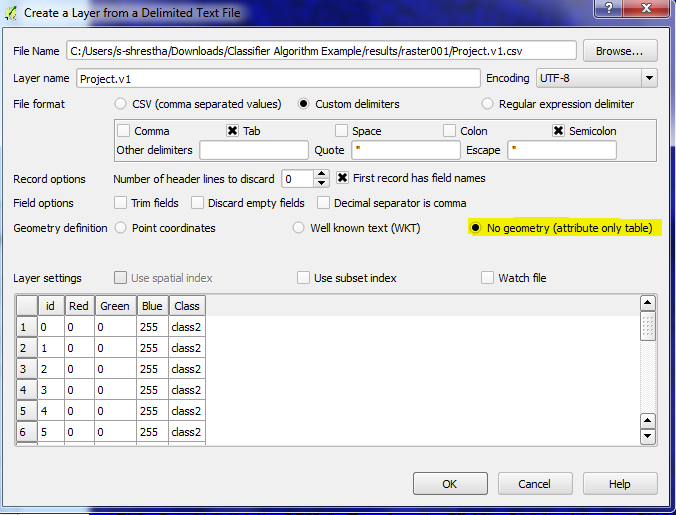 |
| import CSV file into QGIS |
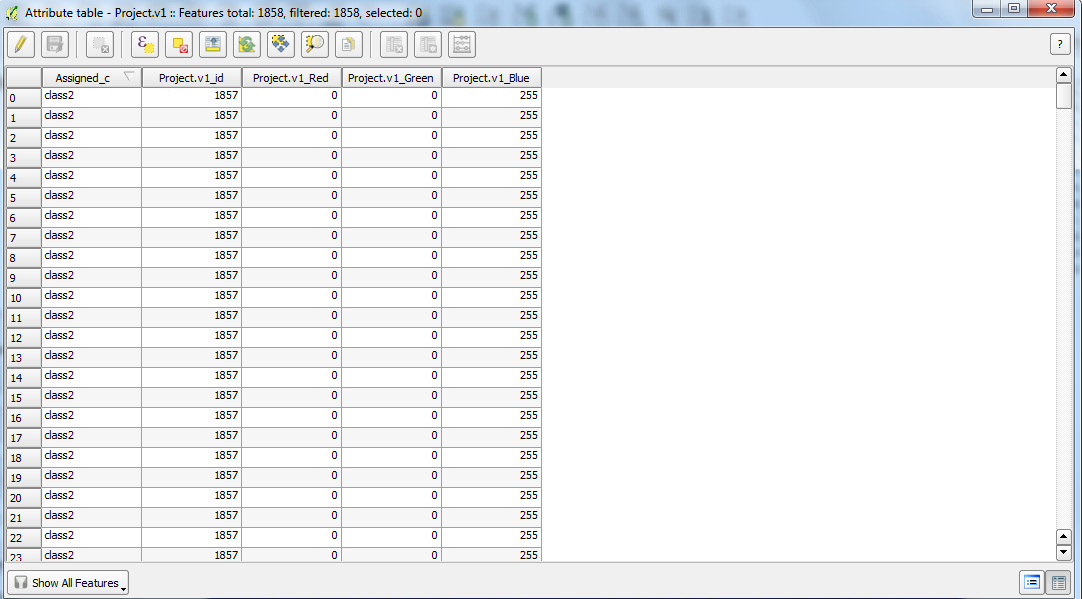 |
| Attribute of shape file after performing join |
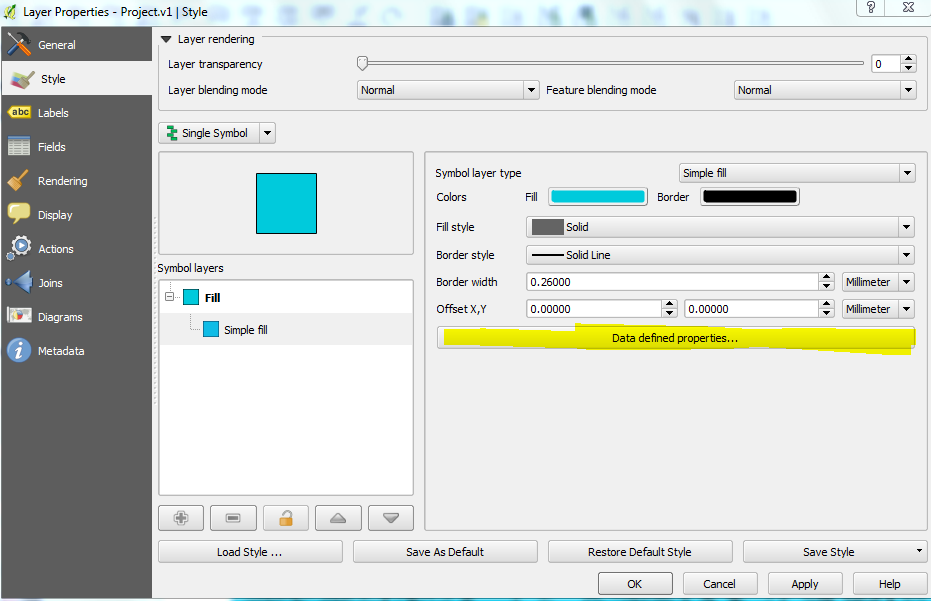 |
| Data defined properties |
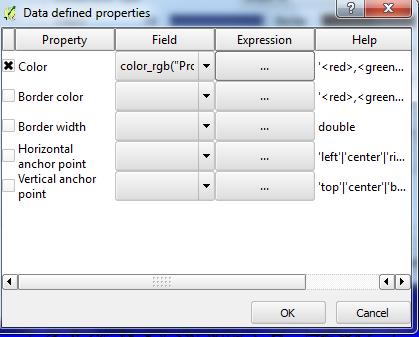 |
data defined properties for color
|
|
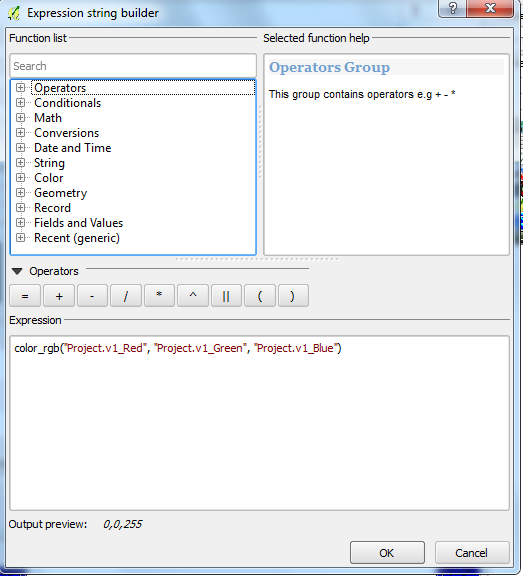 |
| data defined properties for color |
|
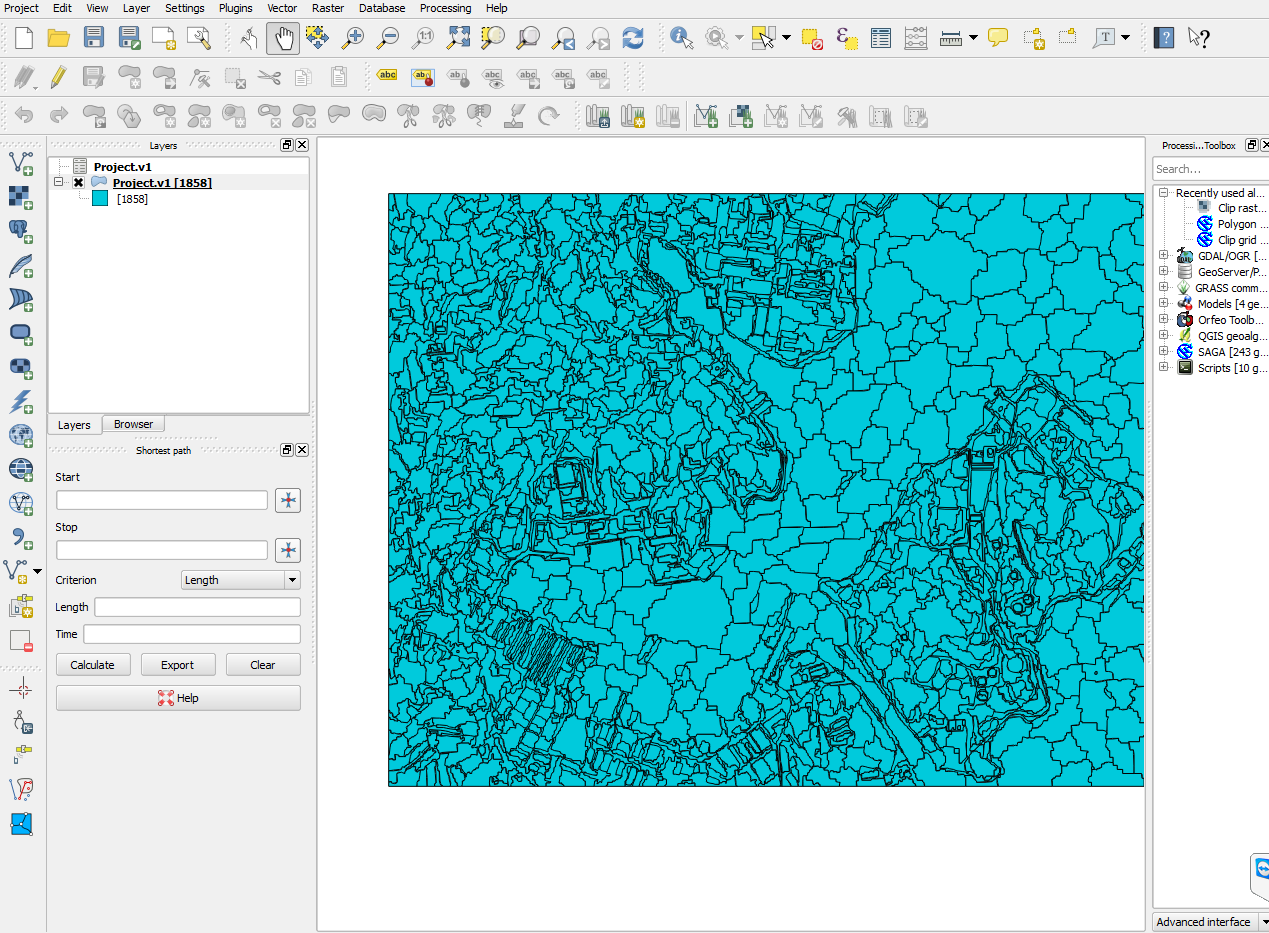 |
| Normal display without color symbology |
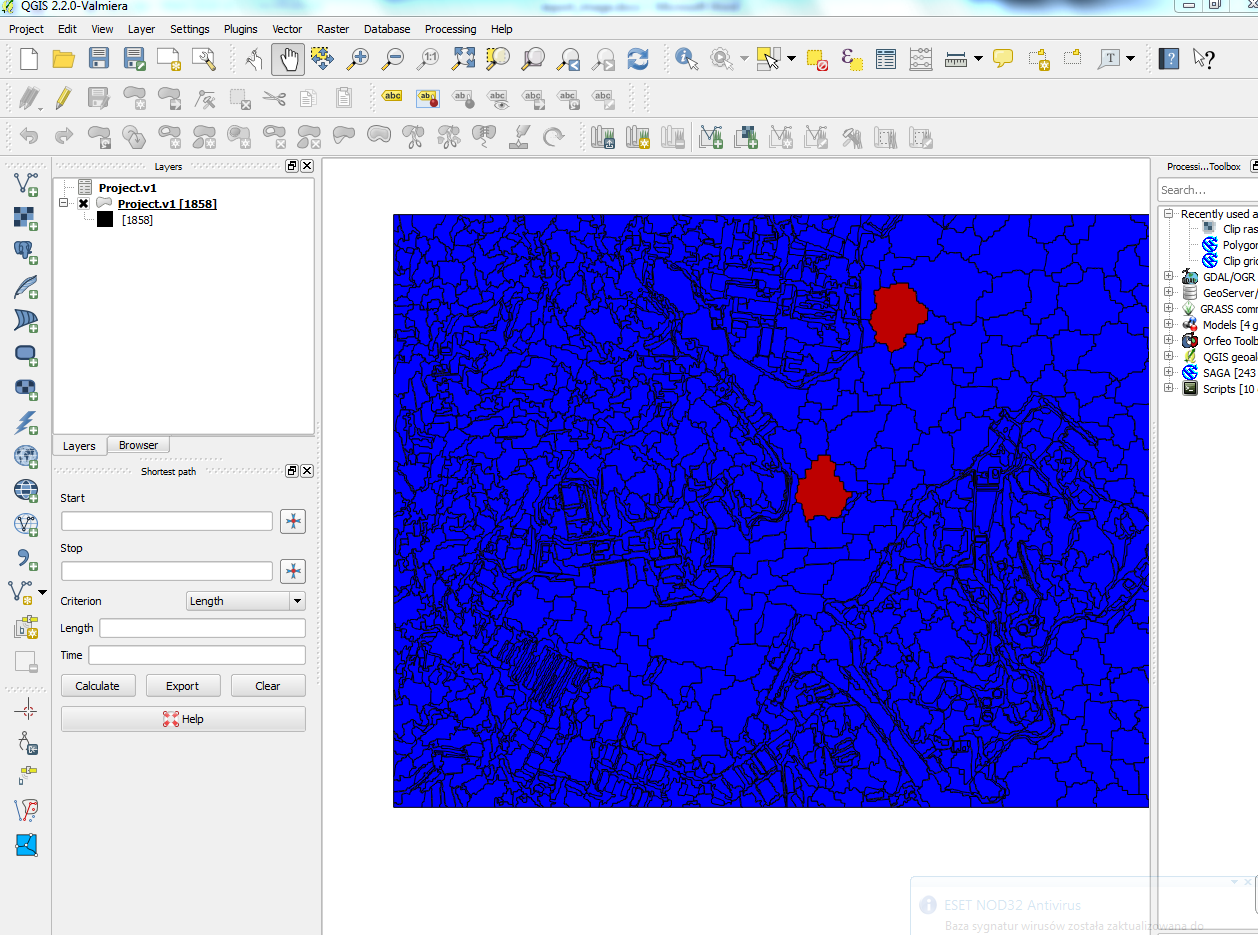 |
| Display with color symbology |
No comments:
Post a Comment